March 4, 2008

Website to make good-looking charts

Reading Time: < 1 minute

I was looking for a way to make a good-looking chart for one of my sites.  I made one in Excel, but it was pretty bland.  Then I discovered the NCES Create A Graph website.  It’s actually a kid’s site, but has some slick tools to make some good-looking charts and graphs.

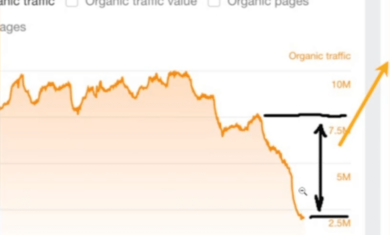
Combined with the WordPress FancyZoom plug-in I showed a few days ago, this can make for a great way to show charts on your website.  Here is the page I used it on, showing the diminishing level of a lake near Atlanta.

buy kamagra-gold online kamagra-gold online

Leave a Reply

Your email address will not be published. Required fields are marked *

Related Posts

Informational keywords don’t help your business

Reading Time: < 1 minuteThe world of search engine optimization has been changing dramatically over the past few years, and you can find many of those changes in my…

Read More

Thrash early, not late

Reading Time: < 1 minuteIn most projects, you need to get a handful of people involved to get their input. The more you can front-load that input, the more…

Read More

Customers are mostly done with their research before they even reach out to you

Reading Time: < 1 minuteIt’s fun to build a website and think about all of the people that will come to your site to do their research about your…

Read More